
Your blended GP is lying: split food and drink before you read it
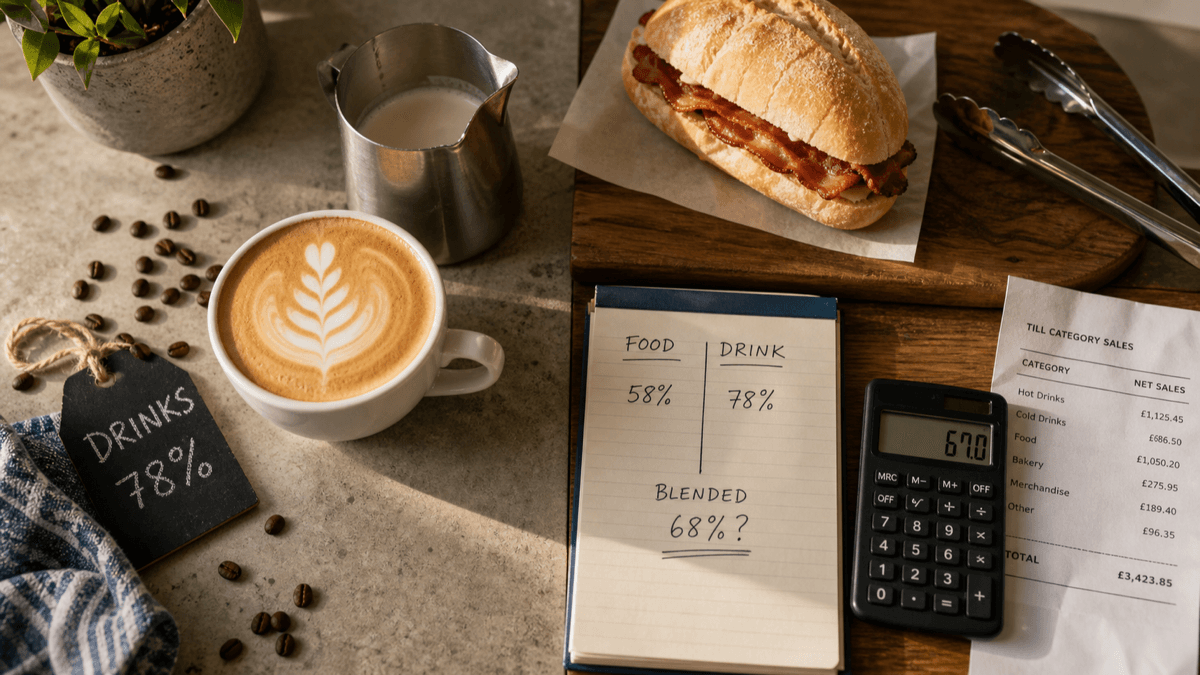
A café owner tells me they are running at 68% gross profit and looks quietly pleased. Fair enough. It is a respectable number.
Then you split it, and it turns out they are an 80% drinks business dragging a 55% kitchen behind them. The coffee is paying the rent. The food is renting space.
Nothing on the P&L says that. One number came out, it looked healthy, and the fact that half the business is underwater got averaged into invisibility.
That is the trouble with a blended GP. It averages two things that behave completely differently, weighted by something you do not control: what the customers fancied that week.
A blended number moves without anything changing
Your blended GP can go up while your kitchen gets worse. It can go down when nothing is wrong at all.
That is because blended GP is not just your margins. It is your margins multiplied by your sales mix, and the mix moves on its own. A sunny bank holiday sells coffee and cold drinks. A wet Sunday sells brunch. Same menu, same recipes, same suppliers, different blended number.
Say you take £8,000 a week ex VAT. Drinks run at 78% GP, food at 58%. Both hold steady all month.
| Week | Drinks (ex VAT) | Food (ex VAT) | Gross profit | Blended GP |
|---|---|---|---|---|
| Sunny week | £5,200 | £2,800 | £5,680 | 71.0% |
| Wet week | £3,600 | £4,400 | £5,360 | 67.0% |
Four points of blended GP, and £320 of actual money, gone between two weeks in which nobody changed a recipe, a price or a supplier. It rained.
Now run it the other way. Say the kitchen genuinely deteriorates, food GP slipping from 58% to 53% because a couple of costings have gone stale. But it is a hot month and drinks climb back to 65% of turnover. Blended GP comes out at 69.3%, up two points on the wet week.
Your dashboard shows an improving business. Your kitchen just lost five points and nobody noticed.
What a healthy split actually looks like
Rough shape for a UK independent café, all ex VAT:
- Hot drinks: 75% to 85%. Milk is the swing factor, alternative milks swing it hard, and matcha is no longer the margin you costed last year.
- Food made in-house: 55% to 70%. A sandwich sits nearer the top, a full cooked breakfast nearer the bottom.
- Bought-in food and retail: 45% to 60%. You are reselling somebody else's margin.
If you want it broken down further by product type, the café GP benchmarks by category go line by line. And if 78% on a flat white sounds implausibly generous, the full cost breakdown behind a £4 flat white shows where it goes once labour and rent take their share.
Two things to be strict about. Every figure here is ex VAT, on both sides of the sum. And GP means ingredients and packaging only, not the barista's wages. Mixing a VAT-inclusive sales figure with an ex VAT cost is the commonest way a café convinces itself it is doing better than it is.
The third bucket everybody forgets
Most operators who do split their GP split it in two: food and drink. That is where it goes wrong.
Bought-in cake, tray bakes from a wholesaler, cans and bottles, crisps, bags of beans on the retail shelf. None of that behaves like the kitchen or like the coffee machine. It is resale. The margin is thinner, it is set by your supplier rather than your recipe, and there is no portioning to improve.
Lump it into food, and your kitchen looks worse than it is. You go hunting for portion control problems in a chef who is doing nothing wrong. Lump it into drinks, and your coffee margin looks soft for no reason you can find.
Three buckets, minimum:
- Barista drinks - anything made behind the machine.
- Made in-house - anything your kitchen or bakery produces.
- Bought-in and retail - anything you buy finished and sell as it arrived.
If bought-in is more than about 15% of your turnover, give it its own line permanently. It is a real part of the business with its own rules.
Getting the split out of your own data
Two sides, and they need to line up.
The sales side
Your till already knows this. What you need is category sales, net of VAT, for a period long enough to be meaningful. Ninety days is plenty.
On Square that is Reports, then Sales, then Category sales, exported as CSV. Take net sales, not gross. Gross carries the VAT on eat-in and hot takeaway, and not consistently across categories, so any margin calculated off it is wrong in a way that is hard to spot.
The awkward bit is usually the categories. Most tills have grown organically and end up with a "Cakes" category holding your own Victoria sponge and a bought-in brownie. Fix that first. It is a dull hour and it makes everything after it work. To see the shape of your current mix before you rearrange it, our free Square category analyser reads the export and shows where the revenue actually sits.
The purchases side
Two ways, and they answer slightly different questions.
The quick way: split your invoices. Take a month of supplier invoices and tag each one, or each line, to a bucket. Coffee, milk, syrups, cups and lids go to drinks. Bread, meat, eggs, flour and butter go to made in-house. The wholesaler's cake box and the drinks fridge order go to bought-in. Mixed invoices need splitting line by line, but a first pass tagged by supplier gets you most of the way.
That gives you actual GP by bucket. It includes waste, theft and over-portioning, everything that happens between the delivery door and the till, which is what makes it useful and what makes it hard to act on.
The cleaner way: recipe cost times units sold. Take each product's costed ingredient cost, multiply by the units the till says you sold, add it up by category. That gives you theoretical GP by bucket.
Theoretical is the better diagnostic because it isolates your recipes and prices, with no stock movement in the way. The difference between it and the actual figure is your waste and control gap. That comparison is the point of putting POS sales data next to your recipe costings, and it is the number most cafés have never seen.
What each number is actually telling you
Drinks GP below about 75%
Almost always one of four things, in roughly this order of likelihood:
- Milk. Steamed too much, jugs poured away, the last inch of every jug down the sink. It is the biggest variable cost in the cup and the easiest to lose without noticing.
- Dose drift. An 18g recipe being pulled at 20g adds about 11% to your coffee cost, and nobody will ever tell you it is happening.
- Alternative milk priced on sentiment. Oat costs more than dairy per litre by a meaningful margin. If your surcharge was set three years ago, it is not covering the gap now.
- Free-poured syrups. Two pumps costed, four pumps served.
Food GP below about 55%
- Stale recipe costs, which is the quiet one. Nothing looks wrong. The number behind the dish is just old.
- Portion drift. Weigh the sandwich filling on three consecutive days and compare it to the spec. This is usually more revealing than anyone expects.
- Bought-in lines hiding in the bucket, dragging the average down and making the kitchen look guilty.
- A high-cost dish selling harder than you assumed. Which is really a mix problem inside your food bucket, and the same sales mix ranking that finds the handful of items carrying your turnover will find it.
MenuBrik (coming soon) does this split off your POS sales against your CostingBrik recipe costs, so the category GP is sitting there rather than being rebuilt from a CSV each month. But the paper version works, and doing it by hand once is what teaches you which bucket you were wrong about.
One thing to do this week
Pull ninety days of category sales from your till, net of VAT. Sort them into three buckets: barista drinks, made in-house, bought-in and retail. Work out what percentage of turnover each one is.
You do not need the cost side yet. Just knowing that food is 31% of your turnover, not the 45% you assumed, changes what you worry about on Monday. Next week, put a GP figure against each bucket and see which one has been carrying the other.
Most of the time it is the coffee. Which is fine, as long as you know it, and are not making decisions about the kitchen based on a number the coffee machine is quietly propping up.
Ed O'Brien has run Hunters Cake Company for 17 years across cafés in Witney, Burford, and a bakery in Carterton, Oxfordshire. He's building Brikly - modular tools that give independent café owners the same data the big chains have, without the big chain price tag.