
Occupancy cost: the fourth benchmark nobody gives you a number for
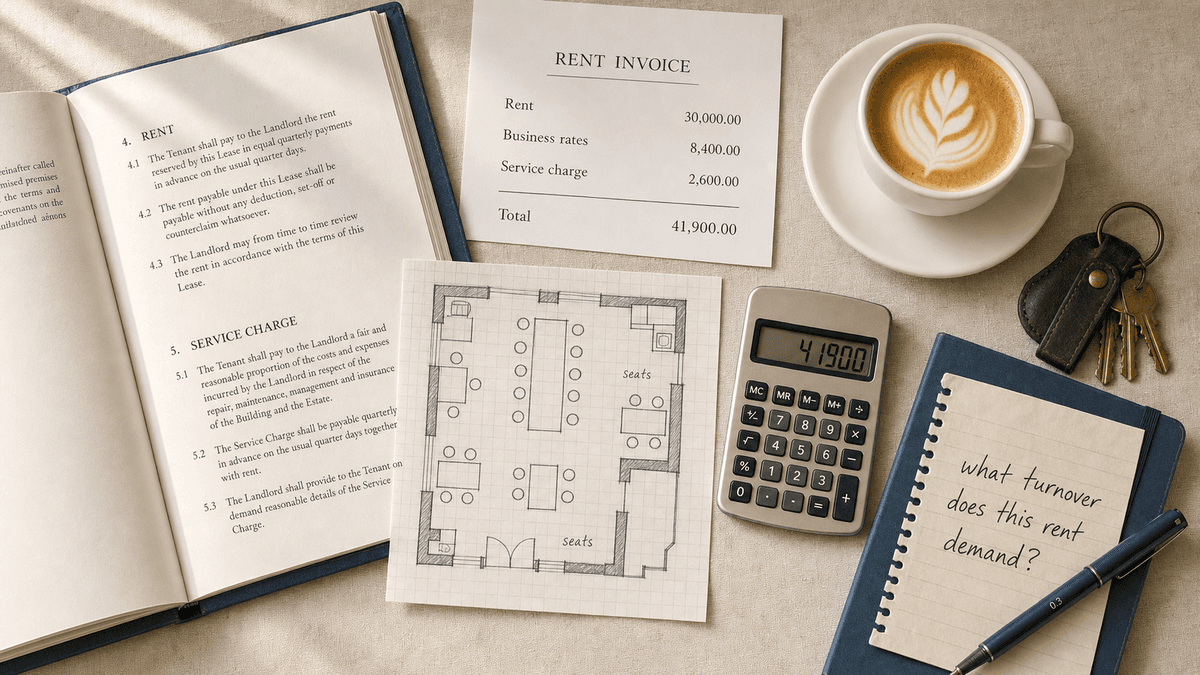
You can probably recite your food cost percentage. You've got a number in your head for wages, you know roughly what your gross profit should look like, and you've read enough to know a healthy net margin sits somewhere north of five per cent.
Then someone asks what your rent should cost you and the answer goes vague. "It's what it is." "It's high for the town, but the pitch is good." Nobody hands café owners a benchmark for the biggest fixed cost they'll ever sign.
That's the gap this post fills. Not how to negotiate it - just what number to hold it against, and what to do when the number is wrong.
Occupancy cost is one number, and it isn't just rent
The first problem is that the cost of your premises is scattered across four or five lines on your accounts, so nobody ever adds them up. Do that first.
Occupancy cost is the annual total of:
- Rent - the headline figure on the lease
- Business rates - net of any relief you still qualify for
- Service charge - if you're in a parade, a centre, or any shared building
- Buildings insurance - where the landlord insures and recharges you
- Turnover rent top-up - if your lease has a percentage-of-sales element
- Ground rent or licence fees - where they apply
Add those together, then divide by your turnover excluding VAT for the same twelve months. That percentage is your occupancy cost.
What stays out matters as much as what goes in. Energy, water, wifi, waste and cleaning are running costs of trading, not costs of holding the space. Occupancy barely moves whether you sell forty flat whites or four hundred, and that's precisely what makes it worth tracking as a ratio. Mix the two and you lose the signal.
Those lines sit in the overheads block of your P&L, spread out and individually unremarkable. No accounting package bundles them for you. Do it once, by hand, and you have a number you can use.
What good looks like
These are rules of thumb, not survey data. They're where independent UK cafés tend to land, in the same spirit as the wage percentage bands for labour.
| Café type | Healthy | Tight but workable | Eating your wage |
|---|---|---|---|
| Coffee-led kiosk or takeaway-dominant | 5-8% | 8-11% | 12% and up |
| Bakery or counter-led café | 7-11% | 11-14% | 15% and up |
| Brunch or all-day café with a big room | 10-14% | 14-18% | 19% and up |
| Multi-site (3 or more) | 8-12% | 12-15% | 16% and up |
Most UK cafés should be somewhere in the 8-15% range overall, and 10% is a fair target if you want one number to aim at.
The spread between formats is about how much room you're paying for. A kiosk carries almost no square footage and no seats, so rent is small relative to what it turns over. A brunch site is the opposite: the room is the product, and you need the covers to justify every square foot of it.
That last column is deliberately labelled. Once occupancy is above the band for your format, the money that would have been your wage is going to the landlord and the council instead. The business still trades. You just don't get paid.
The ceiling, and why it's a hard one
Here's the arithmetic that makes occupancy worth taking seriously. Take a full-service café running reasonable numbers:
- Gross profit: 68% of ex-VAT turnover
- Labour: 35% fully loaded, post-April
- Everything that isn't occupancy: 13% - energy, card fees, repairs, marketing, software, accountancy, depreciation, sundries
That leaves 20 points. Every point of occupancy cost comes straight out of those twenty, and there's nothing else to take it from.
| Occupancy cost | Net margin left |
|---|---|
| 8% | 12% |
| 10% | 10% |
| 14% | 6% |
| 18% | 2% |
| 20% | Nothing |
Leaner formats have more headroom because their labour line is lower, which is why a coffee-led shop survives a rent per square foot that would sink a brunch room on the same street.
It also explains why gross margin work matters more the higher your rent is, not less. Every point you claw back on GP is a point of headroom for the landlord's line, which is the honest case for keeping recipe costs current in something like CostingBrik rather than a spreadsheet you refresh twice a year.
Invert the ratio: what turnover does this rent demand?
This is the part that changes how you use the number.
"Is my rent too high?" isn't answerable in the abstract, and for the next few years it isn't actionable either. The rent is contractual. It doesn't care what you think of it.
The question you can answer is the other way round:
Annual occupancy cost ÷ target occupancy % = the turnover this site demands
Worked through, for a counter-led café:
| Line | Annual |
|---|---|
| Rent | £30,000 |
| Business rates | £8,400 |
| Service charge | £2,600 |
| Buildings insurance recharge | £900 |
| Total occupancy cost | £41,900 |
At a 10% target, that unit demands £419,000 ex-VAT. At 12%, £349,000. At 14%, £299,000.
So the site is asking for somewhere between £299,000 and £419,000, depending on how much of your P&L you're prepared to hand over. Pick the target that matches your format. For a counter-led café with a decent room, 12% is fair, so the number to beat is £349,000 ex-VAT.
Now sanity-check it against the room
A required turnover figure is useless until you test it against seats, turns and spend. Same café: 34 seats, £9.20 average spend ex-VAT, open 310 days a year.
- £349,000 ÷ 310 days = £1,126 a day ex-VAT
- £1,126 ÷ £9.20 = 122 covers a day
- 122 ÷ 34 seats = 3.6 covers per seat per day
Three and a half sittings per seat, every trading day, all year. That's demanding but not fantasy. And if 40% of your trade is takeaway, only about 73 of those covers need a seat at all, which brings it back to 2.2 per seat - comfortable two turns plus a bit at peak.
This is the same arithmetic as your daily break-even covers, pointed at a different question, and table turn is where you find out whether the seats can actually deliver it.
The moment of truth is simple. If the turnover the maths demands is 30% above anything the site has ever done in a good year, the rent isn't slightly high. It's wrong for the room.
One thing that changed in 2026
Plenty of cafés saw their occupancy percentage rise this year without the rent moving a penny. The April revaluation lifted rateable values across hospitality and the last of the retail relief disappeared at the same time, so the other half of the number reloaded on its own. The full picture on the 2026 rates changes is worth reading if you haven't already. The practical point: re-baseline your ratio on post-April figures, because a percentage you worked out in 2024 will flatter you.
Two diagnostics you can run this afternoon
Neither of these requires you to speak to your landlord. They just tell you which problem you've got.
1. Occupancy cost per seat, per year
£41,900 across 34 seats is £1,232 per seat per year. Roughly £24 a week, or about £4 a day for every day you're open, per chair.
That's a room-size diagnostic. Compare it across your sites, or against a unit you're viewing. Then compare it to what a seat actually earns: £9.20 x 3.6 covers x 310 days is about £10,270 per seat per year. Every seat that sits dead through the week still costs its £1,232 and returns nothing.
2. Occupancy cost per trading hour
Open 8.5 hours a day, 310 days, and you're trading 2,635 hours a year. £41,900 across those is £15.90 an hour. That's the meter running from the moment you unlock, before a single wage or a single coffee.
Hold it against your quietest hour. If 8am does £45 ex-VAT at 68% gross profit, that's £30.60 of gross profit against £15.90 of occupancy plus two people on the rota. That hour loses money, and it does so every single morning.
Which problem do you actually have?
This is why you want both cuts rather than just the headline percentage.
- 9% on thin turnover, low cost per seat. The ratio looks healthy because the unit is cheap, not because the business works. Your constraint is trade, not rent. Leave the lease alone and fix the hours, the mix and the seats that aren't earning.
- 14% on strong turnover, high cost per seat. This is a good café paying too much for its address. It trades well and still hands fourteen points to somebody else, and no amount of operational tightening closes that gap.
- Fine percentage, ugly cost per hour. Too few of your open hours are earning their share of the meter. That's a trading-pattern problem, and shortening the day can be the right answer.
Too much room, or too few hours earning it. Those two numbers tell you which, and they cost you nothing to work out.
The takeaway
Occupancy is the fourth benchmark, and it deserves the same discipline as the other three. One number, one percentage, checked once a year against the band for your format.
If you're inside the band, occupancy isn't your problem and you should stop worrying about the rent. If you're above it and the per-seat number is high, the site is genuinely expensive - and the next conversation is the one you have at lease renewal, which is worth starting a year out, not three weeks out.
Rent is the one cost you can't do anything about this week. But you can find out today exactly what it's asking of you, and whether the room can deliver it.
Ed O'Brien has run Hunters Cake Company for 17 years across cafés in Witney, Burford, and a bakery in Carterton, Oxfordshire. He's building Brikly - modular tools that give independent café owners the same data the big chains have, without the big chain price tag.