
How old are your recipe costs? A 20-minute staleness audit
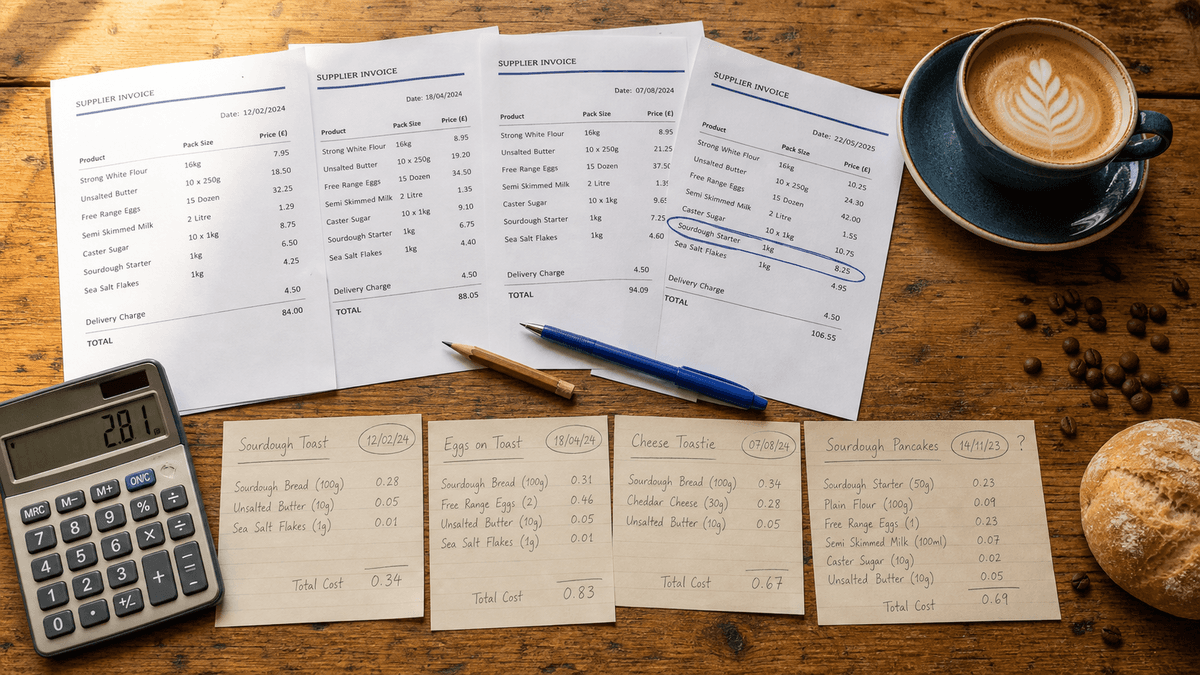
Ask an operator when they last costed their menu and you get a confident answer. Ask them which recipe on that menu has the oldest price sitting behind it, and you get a pause.
I get the pause too. I have had a spreadsheet where the sourdough sandwich was costed on a February invoice and the brownie on a June one, and no way of telling them apart by looking. Both cells said £1.42 in the same font. One of them was true.
That is the actual problem. Not that people do not cost their recipes. Most operators have costed something at some point. The problem is that a costing has no expiry date printed on it, so a wrong number and a right number look identical, and you keep making decisions off both.
Here is a way to find out how bad it is, and more usefully, which ten recipes to fix first when you have forty and one Sunday afternoon.
Nobody knows how stale their costings are, including me
You already understand price drift better than any spreadsheet does, because you do your own shopping. You have watched your own weekly shop move over the past two years. Nobody needs convincing that a six-month-old price is fiction. We just do not apply that instinct to the recipe cards, because the card does not tell us how old it is.
This year the headline numbers actively encourage that. The ONS put food and non-alcoholic drink prices up 1.7% in the twelve months to June 2026, down from 2.2% the month before. (The rate has since fallen again, to 1.3% in July; the Weekly Grind of 24 August sets that against the 4.0% the same release gives for restaurants and hotels.) The BRC-NIQ Shop Price Monitor had food inflation easing again in July, to 2.2% from 2.4% in June. Read that and you would reasonably conclude nothing much is happening.
Look one level down and it stops being calm. Inside that same BRC July number, fresh food went the other way, up to 3.1% from 2.8%, while ambient food fell to 1.1% from 1.9%. Same headline, opposite directions.
Meanwhile, in my own records, the matcha powder I buy went from £0.07035 a gram on 11 March to £0.103275 a gram on 1 July. That is a 47% rise, in three separate moves, on an ingredient that goes into a drink I sell all summer. Nothing in the headline told me. My invoices did.
Price moves down too, which is the other half of why staleness is expensive. My round ciabatta rolls jumped about 31% in May and are back to the earlier price now. Stale in the first direction meant underpricing all summer. Stale in the second means leaving margin on the table on a bestseller. Wrong either way is still wrong.
Give every recipe a date, and be strict about which date
The audit starts with one column, and the whole thing lives or dies on getting this column right.
Next to every recipe, write the date of the invoice that the recipe's largest cost line came from.
Not the date you last opened the spreadsheet. Not the date you last changed the selling price. Not the date you created the card. The invoice date behind the biggest single ingredient in that dish.
Why the largest line? Because it moves the answer. If the ciabatta roll is 60% of the ingredient cost of your bacon roll, a roll that is four months out of date makes the whole costing four months out of date, no matter how fresh the black pepper price is. Chase the line that carries the dish.
A few rules to keep it honest:
- If two lines are within a few pence of each other, take the older date. You are measuring risk, not being generous with yourself.
- A price you typed in yourself is dated the day you typed it, not the day it was true. If you cannot point at an invoice, mark it with a question mark and treat it as older than everything else.
- A price off a price list is not a cost, it is a quote. The invoice is what you actually paid.
- If the same ingredient appears twice under two spellings, the date is lying to you. Half the history sits under one entry and half under the other, so the newest date you can see is not the newest price you paid. That is the duplicate ingredient problem that quietly wrecks recipe costs, and it deserves its own hour.
Once the column exists, band it. My rough working rule after doing this a few times:
- Under 6 weeks old: current. Trust it.
- 6 to 16 weeks: worth a look, especially anything dairy, bread, fresh produce or chocolate.
- Over 16 weeks: treat as a guess. Not necessarily wrong, but you have no evidence it is right.
In my experience a menu splits roughly a third, a third, a third, and the surprise is always which dishes land in the last band.
Rank by exposure, not alphabetically and not by favourite
Now the bit that decides your Sunday.
The natural instinct is to start at the top of the list and work down, or to start with the dish you have been fretting about. Both are wrong, because they ignore how much money is actually flowing through each line.
Rank by exposure:
Exposure = portions sold in a year x ingredient cost of one portion
That is the annual pound value of ingredients passing through that dish. If the ingredient costs behind it drift 10%, roughly 10% of that number comes straight off your gross profit. It is the same logic as ranking your menu by sales value to find the handful of items carrying the business, just pointed at cost rather than turnover.
Here is an illustrative café, with made-up volumes to show the shape:
| Dish | Portions a year | Ingredient cost a portion | Exposure |
|---|---|---|---|
| Flat white | 26,000 | £0.42 | £10,920 |
| Bacon roll | 7,800 | £1.35 | £10,530 |
| Sausage bap | 6,200 | £1.48 | £9,176 |
| Soup of the day | 2,600 | £0.88 | £2,288 |
| Victoria sponge slice | 3,100 | £0.71 | £2,201 |
| Eggs Benedict | 1,040 | £2.05 | £2,132 |
| Beetroot and feta salad | 420 | £1.90 | £798 |
Look at the bottom row. The salad is the dearest dish to make, it is the one people obsess over, and it carries under £800 of ingredient flow a year. A brutal 20% drift on it costs about £160. A quiet 5% drift on the flat white costs £546.
The expensive dish feels risky. The high-volume cheap one is where the money actually is.
The ten you recost first, and the twenty you leave
Sort the list by exposure, highest first. Then read down and take the first ten rows that are also in your 16-weeks-plus band.
That is your list. High flow and old data. Everything else waits.
The permission this gives you is the real point. You are allowed to leave twenty recipes alone until next quarter, because you now have evidence they cannot move your P&L much even if the price behind them is wrong. Guilt about the un-costed salad is not a business risk. An eight-month-old bread price on your best-selling breakfast is.
I saw this play out on my own numbers this year. One roll price moved. It fed two breakfast items that both sell hard, and the annual cost pressure across just those two recipes came out at about £958. One ingredient. Two recipes. Nearly a thousand pounds a year of drift that would have been completely invisible if I had spent that afternoon re-checking the salads instead.
The timing matters right now, too. If you are drafting an autumn menu to go live in September, the ranking tells you which prices to settle before the thing goes to the printer rather than three weeks after.
Why you cannot just look the price up in this country
Here is the bit that catches people out, and it is specific to how UK foodservice works.
You cannot check today's wholesale price the way you check a supermarket shelf. Brakes routes you through a login before you see a price, and its account eligibility page asks you to confirm you represent a UK business or organisation and spend a minimum of £150 per order. Bidfood shows no prices on its public site at all; it is "become a customer", then Bidfood Direct behind a login. On neither site could I find a price without an account.
So there is no shelf to walk past and no public number to check yourself against. Your account prices are yours: negotiated, volume-dependent, and invisible to everyone else until the invoice lands.
Which leads somewhere quite freeing once you accept it. Your own invoices are the only fresh price source you own. In a market where you cannot look the price up, the age of your last invoice is your confidence level. That is why the date column is the whole audit. Once you know which invoice is freshest, the next question is which of those invoice prices belongs in the recipe.
Twenty minutes, this week
You do not need software for any of this. You need a printed menu, your invoice file and a pen.
- List every recipe you sell. Menu order is fine.
- Add a date column. Invoice date behind the largest cost line, per recipe.
- Add annual portions. Ninety days from your till, times four.
- Multiply portions by ingredient cost per portion. That is exposure.
- Sort by exposure and mark everything over 16 weeks old.
- Take the top ten of those. That is your recosting list. Book two hours.
If you want to redo the maths on individual dishes as you go, the free recipe costing calculator will do the per-portion arithmetic without a login.
This is where a tool earns its keep, and it is worth being precise about why. CostingBrik reads your supplier invoices and logs every ingredient price with its date, so the dates this audit asks for are already sitting there rather than something you reconstruct. It does not make the paper version pointless. Run the paper version first, because it shows you in pounds what you have been guessing at, and that is what tells you whether the software is worth paying for.
Either way, the work was never building the costing. It was keeping it current. A costed menu is not an asset. A dated costed menu is.
Go and put a date next to your ten biggest sellers. If any of them says March, you have found your afternoon.
Ed O'Brien has run Hunters Cake Company for 17 years across cafés in Witney, Burford, and a bakery in Carterton, Oxfordshire. He's building Brikly - modular tools that give independent café owners the same data the big chains have, without the big chain price tag.